Adapts and Improvements on Natural Air Ventilation

My semester research project was taking a look into what is natural air ventilation and how it is used. I simply define natural air ventilation as simply just bringing outside air into the building. However wiki would define it out more as “natural ventilation is the process of supplying and removing air through an indoor space without using mechanical systems…wind-driven ventilation and buoyancy-driven ventilation.” The two systems mentioned from wiki have two key ways to design for this ventilation:

  • Wind-driven ventilation: is based on the amount of wind going through the building, if there is too much wind in the space could cause a wind-tunnel effect and would not be pleasant for the users.
  • Bouyancy-driven ventilation: is the air density difference between indoor to outdoor air or differences between rooms. This follows the concept of hot air rises and cool air falls due to the density. Stack effect or the chimney effect is used to achieve this system.

The paper also looked into ASHRAE 55 Standard: Thermal Environment Conditions for Human Occupancy to see how they define natural ventilation. This standard is a base line and gives guidelines to how base thermal comfort in spaces, but there is a few undefined areas that could leave designers confused.  Listed are a few key points.

  • Does not take into account specific locations
  • User’s response to their environments (age, health, activities, gender)
  • Thermal comfort based on a 80%  acceptable, 20% dissatisfaction based from Predicted Mean Vote (PMV) and Predicted Percentage Dissatisfied (PPD)
  • Urban conditions (pollution, security)
  • If you use any mechanical system, then you do not have natural ventilation

I searched for two case studies in the Chicago region to show the diversity of using natural ventilation with mechanical “hybrid” systems. Both are set in private universities and have similar square footage, programs, and only a year apart, but you can see with money, a proper design team, and support can develop these integrated systems. Since the perfect conditions for acceptable natural air ventilation only happen 50-60 days out of the year, the use of mechanical system to help support the natural ventilation in the off periods ,winter and summer months, is needed.

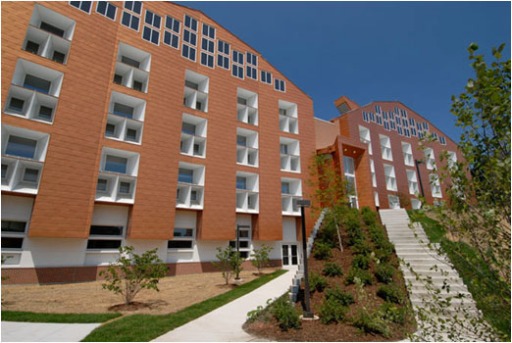
Case Study I: Harm A. Weber Academic Center at Judson University in Elgin, IL (4 story, 88,000sf). The Academic Center opened in 2007 and is one of the first in the region, especially in Chicago.

Image[1]Image[2]

Design methods:

  • Central lightwell acts like the stack/chimney effect
  • Night Flushing
  • Integrated Photo-voltaic (PV)
  • Thermal Massing

Case Study II: Richard J. Klarcheck Information Commons at Loyola University (north side campus) in Chicago, IL (4 story, 70,000sf). Opened in 2008 had one key goal in mind for this new building, a transparent effect to be able to see Lake Michigan.

Image[3]Image[4]

Design methods:

  • Double-Skin Façade (west wall for the stack effect)
  • Night Flushing
  • Radiant ceiling (for cooling)
  • Thermal Massing
  • Automated shading system

There is no wrong or right answer when it comes to natural air ventilation when it comes to the guidelines engineers have. This is not a new technology and is climate and urban sensitive on locations. When it comes to challenging standards or pushing the limits, there must be a good team (architects, multi-field engineers, stakeholders, etc.) to develop the proper combination of systems for the building. After a couple of years if the building is not performing to expectation there needs to be flexibility to the design since a lot of estimation/trial and error occur when dealing with natural air ventilation.

Sources:

[1] http://www.shalesmcnutt.com/projects/education/judson-university-harm-a-weber-academic-center/

[2] Kaiser, Keelan P., and David M. Ogoli, Ph.D, (2010) “The Harm A. Weber Academic Center

and the Greening of Judson University.” Judson University, 1-12.

[3] Image from author

[4] District Energy by Elara
Light conditions and window position

When striving for net zero buildings one of the important challenges is to reduce the energy consumption due to artificial lighting. Buildings have to be designed to utilize natural daylight as a replacement for artificial lighting. In order to do so window type and position are important factors that have to be considered.

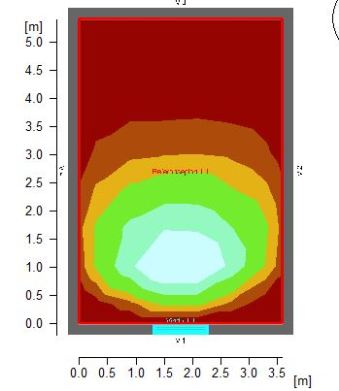
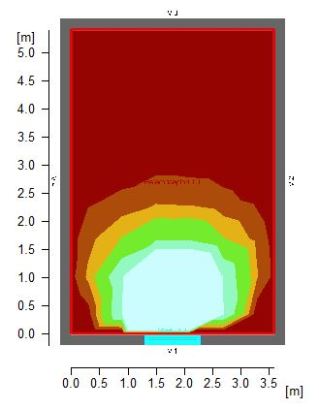
The lighting software Relux makes is possible to predict how light from windows will be distributed throughout a room. The software calculates light distribution based on parameters such as location, sky conditions, room size, window size, window placement, reflectivity of surfaces etc. It turns out that how the window is placed very much determines how well the light is spread throughout the room. Just look at these three illustrations.


Image


Image


Image


All the illustrations represent an office room located in Chicago. The simulations are set to represent cloudy weather, June 1st at noon. Besides positioning of the window all other parameter are the same.

The first illustration represents a window placed in a high position, close to the ceiling. The second represents a window placed on the middle of the wall and the last one represents a window placed close to the floor. We clearly see that windows placed on the upper part of the wall are much more capable of distributing light deep into the room.  This means that allowing for windows to go all the way to the ceiling can potentially reduce the need for artificial lighting. 

LEED vs. Energy Efficiency: A Close look into LEED-Certified Building’s Energy Efficiency Data

In 2000 the Leadership in Energy and Environmental Design (LEED) rating system for building energy efficiency was launched by the United States Green Building Council (USGBC). LEED grew fast in popularity and soon it became commonly known as the leading “green energy/building” rating system. Perhaps too fast as little performance data has ever being available to confirm this allegation.

To ease the controversy, in 2006 the USGBC hired the New Building Institute (NBI) with support of the U.S. Environmental Protection Agency to generate a report on the LEED certified building energy efficiency performance thus far. The final report was published in March 2008 and concluded that: on average, LEED certifications energy use was 25-30% better than the national average (Frankel & Turner, 2008).

The New Buildings Institute Final Report

To complete the United States Green Building Council’s (USGBC) LEED study request, the New Building Institute asked all LEED-New Constriction version 2.0 certified building’s owners to submit at least a full year measured post-occupancy energy usage data for the entire LEED project. Of the eligible 552 projects only 121 (22%) contributed with their results. With the data collected from the owners, the NBI was able to validate the LEED rating system through the completion of three unrelated studies. The first assessment, and least accurate, assessed the different Energy Use Intensity (EUI) values between LEED and non-LEED buildings. The second study evaluated the Energy Star Rating of LEED buildings vs. Non-LEED. The last strategy compared the post-occupancy measured energy data to the initial modelled energy used expectations. According to the NBI the results show that LEED certified projects “…average substantial energy performance improvement over non-LEED building stock…” (Frankel & Turner, 2008).

1.   Energy Use Intensity (EUI) of LEED and national building stock according to building type.

On their first study, the MBI developed a method for paring each LEED building with one of similar characteristics from the 5215 sampled buildings analyzed on the Commercial Building Energy Consumption Survey (CBECS), a quadrennial survey of building energy performance directed by the U.S. Energy Information Administration (Birt, Mancini, & Newsham, 2009).

The New Building Institute report provided a full year of measured post-occupancy energy usage data for each of a 100 LEED certified buildings. For each one the total Energy Use Intensity (EUI) measured in KBtu/ft2/yr was derived from the sum of the total purchased energy of all fuel types (available for only 71 of the buildings). Later on, this was then compared to the initial baseline and design models in LEED submittals (Frankel & Turner, 2008).

vic1
Figure 1:
EUI (KBtu/ft2) Distribution (Frankel & Turner, 2008).

Figure 1 distributes the results by LEED certification level and displays the Commercial Building’s EUI (KBtu/ft2/yr) for all the 100 LEED-New Construction. The median measured EUI was 69 KBtu/ft2, 24% lower than that of the CBECS national average which was measured at 91 KBtu/ft2. For the most common type: office spaces, LEED averaged a EUI of 33% below CBECS. Additionally, gold and platinum buildings shows a 50% energy saving than that of the CBECS office average. This graph omits the 21 buildings from the study with a median EUI of 238 KBtu/ft2; the NBI chose to eliminate them because these activity types (data centers, supermarkets, and labs) contain a very high energy activity levels driven by constant changing occupancy, and making their analysis more complex (Frankel & Turner, 2008).

2.   Energy Star ratings of LEED buildings

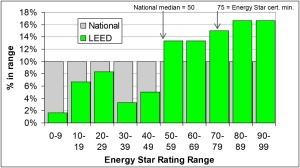
The U.S. Environmental Protection Agency’s (EPA) Energy Star program rates building’s energy use in relation to existing national building stock. The pairing is based primarily on building’s activity type, and secondarily on their location’s temperature, schedule, and occupancy respectively. The average Energy Star rating of the national building stock was 50, compared to a median rating of 68 for the LEED buildings. Figure 2 shows that one quarter of LEED certified buildings had ratings below 50, meaning they used more energy than average for comparable existing building stock (Frankel & Turner, 2008).

vic2
Figure 2:
Energy Star Rating of LEED vs. National Building Stock (Frankel & Turner, 2008).

3.  Post-occupancy measurements vs. Initial design modelled energy used expectations.

Measured energy savings for the buildings in this study (Figure 3) average 28% compared to the energy cost budget (ECB) baselines, close to the average 25% savings predicted by energy modeling in the LEED submittals.

vic3
Figure 3:
 Measured versus Proposed EUIs in KBtu/ft2 savings (Frankel & Turner, 2008).

At the extreme, several buildings use more energy than the projected code baseline modeling, as shown in the comparison of measured vs. estimated savings in Figure 5. The NBI justified this degree of scatter by suggesting the need for improvement in the accuracy of energy use prediction on an individual project basis (Frankel & Turner, 2008).

vic4
Figure 4:
 Measured vs. Proposed Savings Percentages (Frankel & Turner, 2008)

Discussion of the Analysis

There is far too many flaws on the NBI’s analysis:

  • Biased results by exclusively gathering data from the LEED certified building owners.
  • Uneven results due to the comparison of two different metrics of central tendency: the median EUIof the LEED buildings to the mean EUI of all US commercial buildings.
  • NBI delivery chose to ignore the data from 21 LEED buildings with the highest EUI such as data centers, labs, and supermarkets by claiming that their analysis required more complexity and therefore only focused on the remaining 100 medium energy use buildings office buildings only.
  • Platinum signifies the maximum energy saving point system in the LEED ranking, yet the NBI study only included 2 LEED platinum buildings.
  • Failed to create a successful subgroup of non-LEED building with which to compare their LEED certified building data, and therefore failed to accurately match all LEED buildings with CBECS matches.
  • Little account between the two datasets regarding climate zone, building size or age.
  • Failed to appropriately weight for building size in calculating average LEED energy utilization intensities (EUI).
  • Focused on site energy rather than primary or source energy.

In conclusion, all of these factors raise a considerable amount of questions regarding the credibility of the LEED building rating systems. Further work needs to be done to define the authenticity of the LEED certification system.

References

Frankel, M., Turner, C. (2008). Energy Performance of LEED for New Construction Buildings-Final Report. New Buildings Institute, White Salmon, WA. Retrieved from https://wiki.umn.edu/pub/PA5721_Building_Policy/WebHome/LEEDENERGYSTAR_STUDY.pdf

Leite, F., Stoppel, C. M. (2013). Evaluating building energy model performance of LEED buildings: Identifying potential sources of error through aggregate analysis, Energy and Buildings, 65, 185-196. Retrieved from  http://www.sciencedirect.com/science/article/pii/S0378778813002521

Pérez-Lombard, L., Ortiz, J., Pout, C. (2008). A Review on Buildings Energy Consumption Information, Energy and Buildings, 40 (3), 394-398. Retrieved from http://www.sciencedirect.com/science/article/pii/S0378778807001016

Scofield, J. H. (2009). Do LEED-certified buildings save energy? Not really…. Energy and Buildings, 41(12), 1386-1390. Retrieved from http://www.sciencedirect.com/science/article/pii/S037877880900187X


Phase Change Materials in building science

A new innovative type of material is the PCM. Indeed, one of the advantage is their ability to store heat and release it when there is demand. This is really useful to be able to control the release of heat in order to take advantages from solar heat which is uncontinuous. PCMs are able to store the calories and release it by changing from one state to another depending on the temperature conditions without it affects the external temperature of PCM. The most interesting point about them is that this type of material can store  3 to 4 times more than traditional construction materials for the same thickness by increasing the building inertia.

In this project, I have introduce the concept of phase change materials in order to consider their performance in the construction field. In a second part, I have tried to simulate the efficiency of gypsum plasterboards with microencapsulated PCMs with the energy modeling software IES-VE.

PCMs are a type of material that enables thermal energy storage, heat or cold. One important fact is that it has to be a reversible melting/freezing cycle in order to be able to released the stored energy. The physical process in this case is latent heat because of the phase change. In this paper, I have focused on solid-liquid PCMs. For this type, the phase melting/solidifying can store a large amount of heat or cold. The advantages are the possibilities to find such PCMs with the following characteristics during the phase change: small volume change, small pressure change, constant temperature.

PCMs can be microencapsulated or macroencapsulated in order to prevent leakage of the liquid during the melting phase in other materials. There are also three types of PCMs: organic, inorganic, eutectic.

We are now aware that energy storage in building envelopes can be enhanced by the utilization of PCMs. They can fulfill two functions: thermal energy storage unit and element of construction. PCMs by increasing the thermal inertia can improve thermal comfort in summer as well as in winter.

An application of PCMs in building science that I describe in greater details in my paper can be the use of them in windows. In fact, a layer of PCM can be inserted in the glazing system and then improves its performances b absorbing solar radiation, reducing the cooling and heating demands, and enabling the daylight to be enjoyed inside of the building. There is an example of such glazing unit in this publication (http://www.sciencedirect.com/science/article/pii/S221260901300023X). This study deals with a four-pane glazed system with the insertion of a PCM layer and also a smart layer that regulate the solar transmittance. They are taking advantages of the transparent even translucent aspect of paraffin as PCM.

vertical section of four pane glass

I also describe the application of PCMs in walls and the possibility to simulate it on energy simulation software such as IES-VE.

A Cold-Climate Case Study for Affordable Zero Energy Homes

yingzhang201308

This project, supported by the U.S. Department of Energy’s Building America Program, is a case study in reaching zero energy within the affordable housing sector in cold climates. The design of the 1200 square foot, 3 bedroom Denver zero energy home carefully combines envelope efficiency, efficient equipment, appliances and lighting, and passive and active solar features to reach the zero energy goal. 

 Image

From April 2006 through March 2007 the home’s 4kW PV system produced 5127 kWh of AC electricity. Only 3585 kWh of electricity and 57 therms of natural gas were used in the home during this period. On a source energy basis, the home produced 24% more energy than it used. The energy used for space heating, water heating, and lighting have been dramatically reduced through superinsulation, passive solar tempering, solar water heating, compact florescent lights and other efficiency measures. The energy used in the home is now dominated by appliance and plug loads determined by occupant choices and behavior. These loads constitute 58% of all the source energy used in the home. Because these loads are generally outside of the control of the home designer and vary considerably with different occupants, sizing a PV system to achieve zero net energy performance is challenging.

 Image

This case study demonstrates that it is possible to build efficient affordable zero energy homes in cold climates with standard building techniques and materials, simple mechanical systems, and off-the-shelf equipment. 

View original post

Building Chernobyl’s New Safe Confinement

Firstly, this is not necessarily a blog about Building Science, but was interesting enough to post up.

Schmieman, a civil engineer from Pacific Northwest National Laboratory in the US, is currently senior technical advisor on what might well be one of the challenging and impressive engineering projects in the world today, the €1.5bn international effort to clean up the remains of mankind’s worst nuclear accident.

Known as the Shelter Implementation Plan (SIP), the project is funded through the European Bank for Reconstruction and Development (EBRD) by 46 different countries and organizations

But the SIP’s crowning glory – is, without a doubt, the construction of the New Safe Confinement (NSC) – an immense steel arch, designed to last for 100 years, which will protect the sarcophagus from the elements, and enable engineers to safely and methodically tidy up a nuclear legacy that has troubled the world for the past 27 years.

Standing 110m high, 250m wide, 150m long  and weighing in at 30,000 tons, the NSC is currently being assembled 600m away from the damaged reactor where, thanks to the remediation work of the past two  decades, the relatively low ground-level radiation dose levels enable engineers to work for up to 40 hours a week. If all goes to plan, at some point in 2015 the shelter will briefly become one of the largest moving structures on land as engineers begin carefully sliding it along vast tracks to its final resting place.

Given that Ukrainian authorities have deemed the 30km exclusion zone around Chernobyl won’t be completely safe for another 20,000 years it’s perhaps surprising to learn that it’s safe to work at the site. But according to Schmieman the dose levels in the so-called “erection zone” are lower on the ground than those that he would experience in his office back in Washington state, where the local geology is responsible for far-higher doses of background radiation.

Nevertheless, Chernobyl remains an exceptionally hazardous place. Many areas within the facility are completely sealed off, and dose rates close to the reactor are extremely high. ‘The hazard increases as you get closer to the source and it’s a deadly hazard if you get close enough,’ said Schmieman. Little wonder that a remote assembly technique was viewed as so attractive.

Work is now well under way on the structure. Last November, the first segment of the arch was lifted to an interim height of 22m and with the end of the harsh Ukrainian winter now in sight, Chernobyl’s international team of engineers is preparing to return.

This spring, further sets of legs will be added until half of the arch is complete. Work will then begin on the identical second half of the arch, and ultimately the two halves will be bolted together. 

With the shelter designed to remain in place for at least 100 years, a host of monitoring and control systems will help to keep it safe and reduce the need for regular maintenance. And Schmieman’s team has devised a particularly elegant solution to the problem of corrosion.

‘There are quite a few steel structures in the world that have already lasted 100 years,’ he said. ‘The one that comes instantly to mind for most people is the Eiffel Tower. They’re continually repainting the Eiffel tower because that’s the cheapest thing to do, but we can’t do that because of the hazard of the radiation dose rates up close to the reactor.’

Instead, the outside of the shelter’s tubular steel structure is protected from corrosion by an air-conditioning system that circulates through the 12m space between the shelter’s tubular steel structure and its stainless steel cladding.

This air is blown into the gap through large desiccant dryers, which remove moisture for the air and maintain it at less than 40 per cent humidity, a condition under which carbon steel will not corrode. This system recirculates around 45,000 m3 of air per hour, at a pressure around 50 Pascal’s higher than the outside air to prevent areas of stagnation developing inside.

The system also heats the air in the annular space to a temperature around 3°C warmer than the air inside the shelter. Incredibly, the NSC is one of a handful of buildings that will enclose a volume of air large enough to create its own weather. But by maintaining a temperature difference between the upper surfaces and the air within, condensation, and the prospect of “rain” falling on the shelter’s radioactive contents, will be avoided.

The new shelter is being assembled just 600m away from the existing Sarcophagus


The jacks used to lift the structure are the same devices that raised sunken Russian submarine The Kursk


Note – See corresponding video on other blog posts

References:

Excell, Jon. “Building Chernobyl’s New Safe Confinement.” The Engineer. Centaur Communications Ltd, 11 02 2013. Web. 25 Nov 2013. <http://www.theengineer.co.uk/in-depth/the-big-story/building-chernobyls-new-safe-confinement/1015479.article&gt;.

Thermo-bimetal Skin

Thermo-bimetal Skin

Doris Kim Sung is an Architecture Professor at USC with a background in biology. She has been investigating the functions of the human skin and comparing that to the functions of a building skin. In her TED talk in May of 2012 Doris was describing the current problem with building systems which is the amount of energy used to heat/cool our buildings.

Our heating and cooling systems have become so sophisticated that we are no longer thinking about minimizing the amount of heat transfer between exterior and interior. This means that we are using enormous amounts of energy to heat/cool buildings just because we have the ability to do so. In the past, an engine would overheat from the extended use of the air conditioner, but today, you could go on a road trip across the country and run your AC the entire time.  Today’s use of HVAC systems and the heat that they emit to the environment is a large contributor to the heat island effects of urban areas.

Traditional building envelopes relied on thermal mass and small openings to limit the amount of heat transfer between the interior and exterior but with the advent of plate glass, rolled steel and mass production that prompted the Modernist movement, the modern building envelope has evolved to floor to floor sheets of glass. Windows are no longer operable: often times in large office buildings when power is lost, the building is not habitable due to the extreme temperatures inside.

Sung explains thermo-bimetal she is developing that changes shape due to temperature differences in an attempt to regulate temperature like the human skin does. This smart material requires no energy or control and just reacts dynamically to the present conditions of the building skin. At frame 4:30 of her TED talk you can see the exploration of BLOOM, a thermo-bimetal canopy that reacts to create shading as well as allows for ventilation.

The link to Sung’s TED talk can be found here where she also discusses other more marketable building components and the inspiration of Grasshopper respiratory systems for ventilation in buildings as well. http://embed.ted.com/talks/doris_kim_sung_metal_that_breathes.html

For other cool heating and cooling techniques check out this TED blog. http://blog.ted.com/2012/06/22/5-amazing-spaces-with-surprising-ways-to-stay-cool/

Salt Heat Transfer Fluids in CSP

Hmmm, needs more salt. A common phrase utilized for food when it doesn’t have much taste. Nowadays, studies have shown that salt can help with solar panels. How, might you ask? Salt has been shown to help with lowering the cost it takes to operate a CSP system, by improving the efficiency of the system, and the system being able to operate at high temperatures.

So what exactly does adding salt to an CSP system do? According to ASME, adding salt can raise temperatures up to five hundred and fifty degrees Celsius. With this happening, greater efficiencies can be achieved. The types of salts utilized in these systems are either molten or liquid salts. For molten salts, these are more commonly seen in power plants utilizing heat transfer.

Why use salts instead of the usual oil-based HTF’s? The reasons are simple. Salt is much cheaper making it more cost efficient, it is much more dense, and finally it can retain more energy per volume so it improves the efficiency. In addition, salt can be stored at ambient temperature unlike oil-based HTF’s. This is much more efficient because less storage tanks will be needed. The advantages don’t stop here though. Salts also pollute much less, nonflammable, abundant, low vapor pressures, and cost-efficient.

Although salt offers several benefits, it has a negative aspect that can affect CSP systems. This aspect occurs when salt freezes. If the salt in some way melts below its freezing point, it tends to freeze. This freezing effect then causes contractions and expansions. If the pipes in the system contain salt that is frozen as such, they can burst or rupture. This is one of the risks of utilizing salt.

Resource:  https://www.asme.org/engineering-topics/articles/heat-transfer/salt-heat-transfer-fluids-in-csp?cm_sp=Heat%20Transfer-_-Feataured%20Articles-_-Salt%20Heat%20Transfer%20Fluids%20in%20CSP

GRAPHENE, a technological promise to shake up industries ans technologies

Image

Graphene is called the material of the future. 

Nowadays, researchers are focus on the study of nanomaterials. They can be obtained from many different elements or chemical compounds, but scientists have paid attention in Carbon.

Graphene is an allotrope of Carbon. It present very interesting properties, because of its structure, such as impermeability, hardness, resistance, lightness and high conductivity  which exceed cooper and silver.

It was discovered in 2004 by Andre Geim, who has been rewarded with the Nobel Prize in Physics (2010) for showing the implications in its behaviour in areas that go from the quantum physics until electronic consumptions.

It is considered the strongest material in all over the world. It is the thinnest and lightest material known until now. It is as light as carbon fiber, but even more resistant. A good point of this new material is that it does not damage the environment because it does not generate any harmful residue.

It has a bi-dimensional structure. The atoms are strongly joined in an uniform and plain surface with light waves of just one atom of thickness. Its configuration is like a honeycomb because of the hexagonal atomic configuration.

It is obtained from graphite, many methods are being studied but the main problem is the lack of one to produce in large-scale. It is commercialized in two ways: in a sheet form (best quality) and in powder form (less quality but cheaper). 

Because of its properties, this material can be applied to many fields that can’t be even counted. The most promising ones are: Renewable energies (photovoltaic cells), electronic (ultrathin and flexible screens), new composite materials,water treatments (desalination).

However, apart from being this technology very promising in a new future in some fields, in other areas it still in investigation and it will require several years until come up some results.

Graphane is created just modifying graphene by adding hydrogen atoms in both sides of the matrix.  The main difference between both is that grephene is a conductor whereas graphane is an insulating material. However, it maintains the mechanical properties.

Silicene is a Silicon sheet with an atomic thickness and with the same properties as graphene. It is said to be the substitute of it. It is said to be the substitute of it because it is easier to integrate this element to the industry due to the fact that it has been more studied and there is more knowledge of it.

Many companies and universities are investing in graphene because they have seen a future in it. Some examples are:

–          Massachusetts Institute of Technology (MIT), [U.S]

–          IBM, [U.S]

–          Graphenea, [Spain]

–          BASF, [Germany]

–          Carbon Solutions, Inc., [U.S]

–          Georgia Tech Research Institute (GTRI), [U.S]

–          University South California (USC), [U.S]

–          Quantum Materials Corp.

–          Samsung Electronics, [South of Chorea]

–          Sungkyukwan University Advanced Institute of Nano Technology, [South of Chorea]